

Welcome to Phase 4 of your data journey! Python is one of the most versatile and widely used programming languages in the data world. In this phase, you’ll learn how to manipulate, clean, analyze, and visualize data using powerful Python libraries.
1️⃣ Introduction to Python
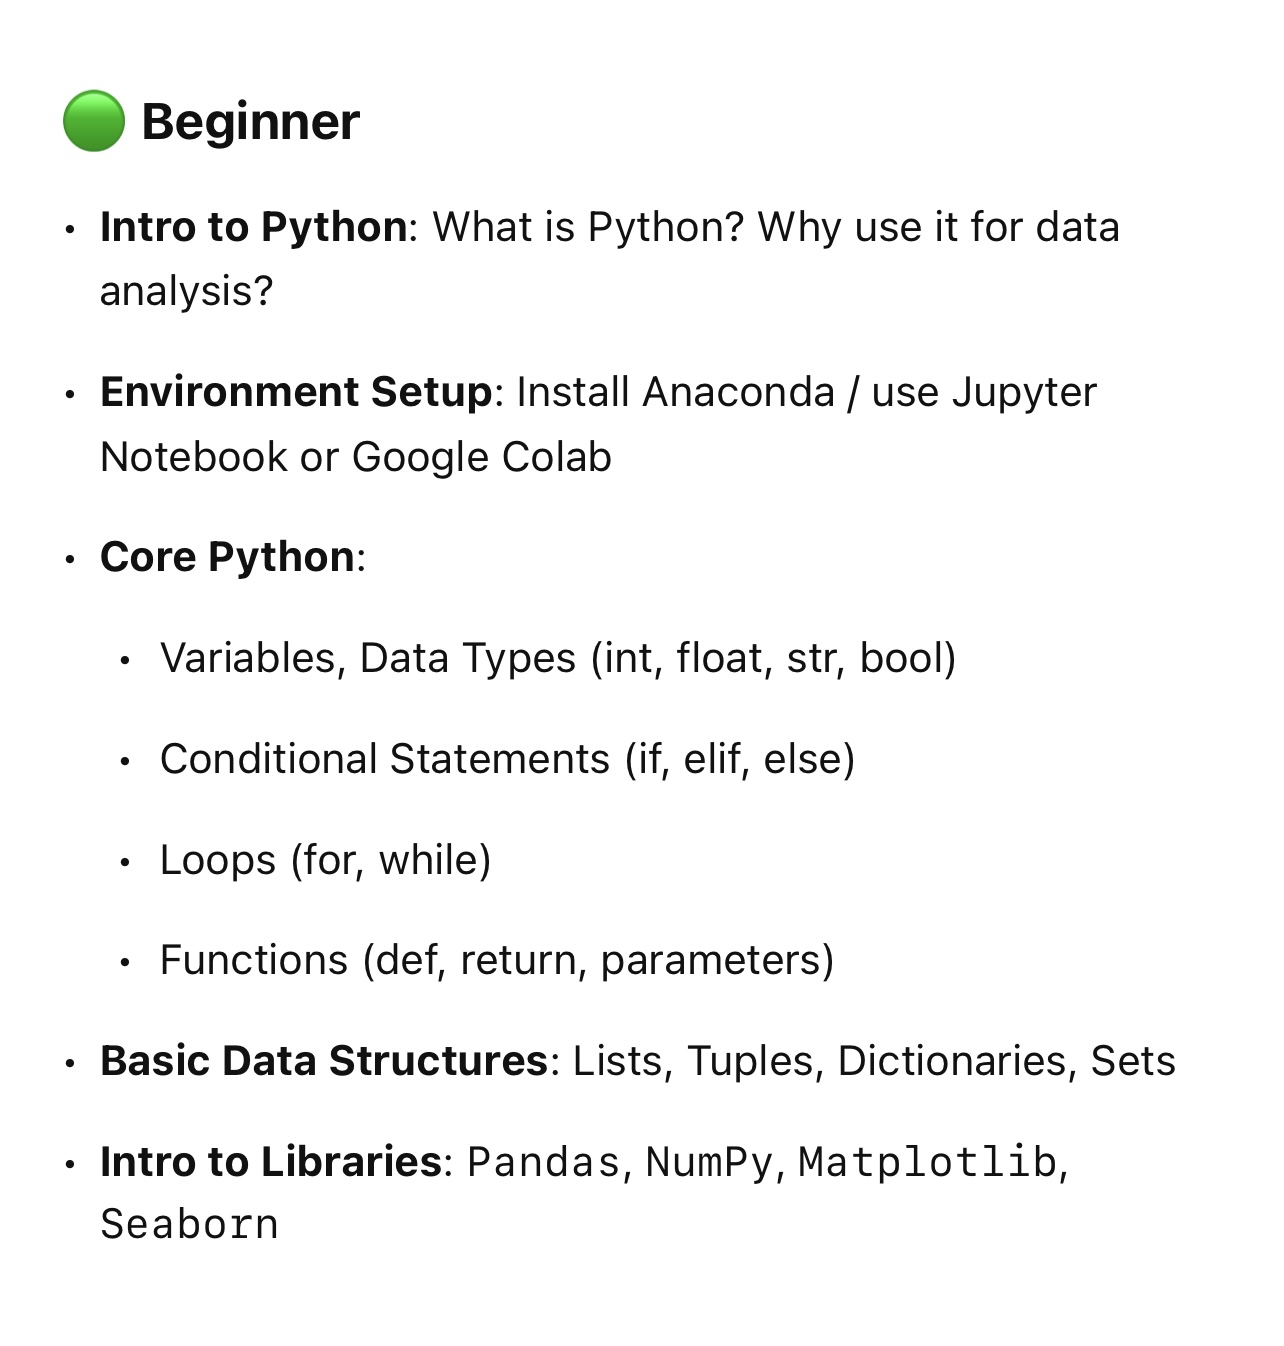
Let’s start with the basics of Python and why it’s essential for data analysts:
- 💬 Why Python for Data Analysis?
- 🛠️ Set up your environment: Jupyter Notebook, Google Colab, or VS Code
- 📚 Learn Python fundamentals: Variables, Data Types, Loops, Functions, Conditionals
- 📦 Intro to key libraries:
Pandas,NumPy,Matplotlib,Seaborn
2️⃣ Pandas for Data Manipulation
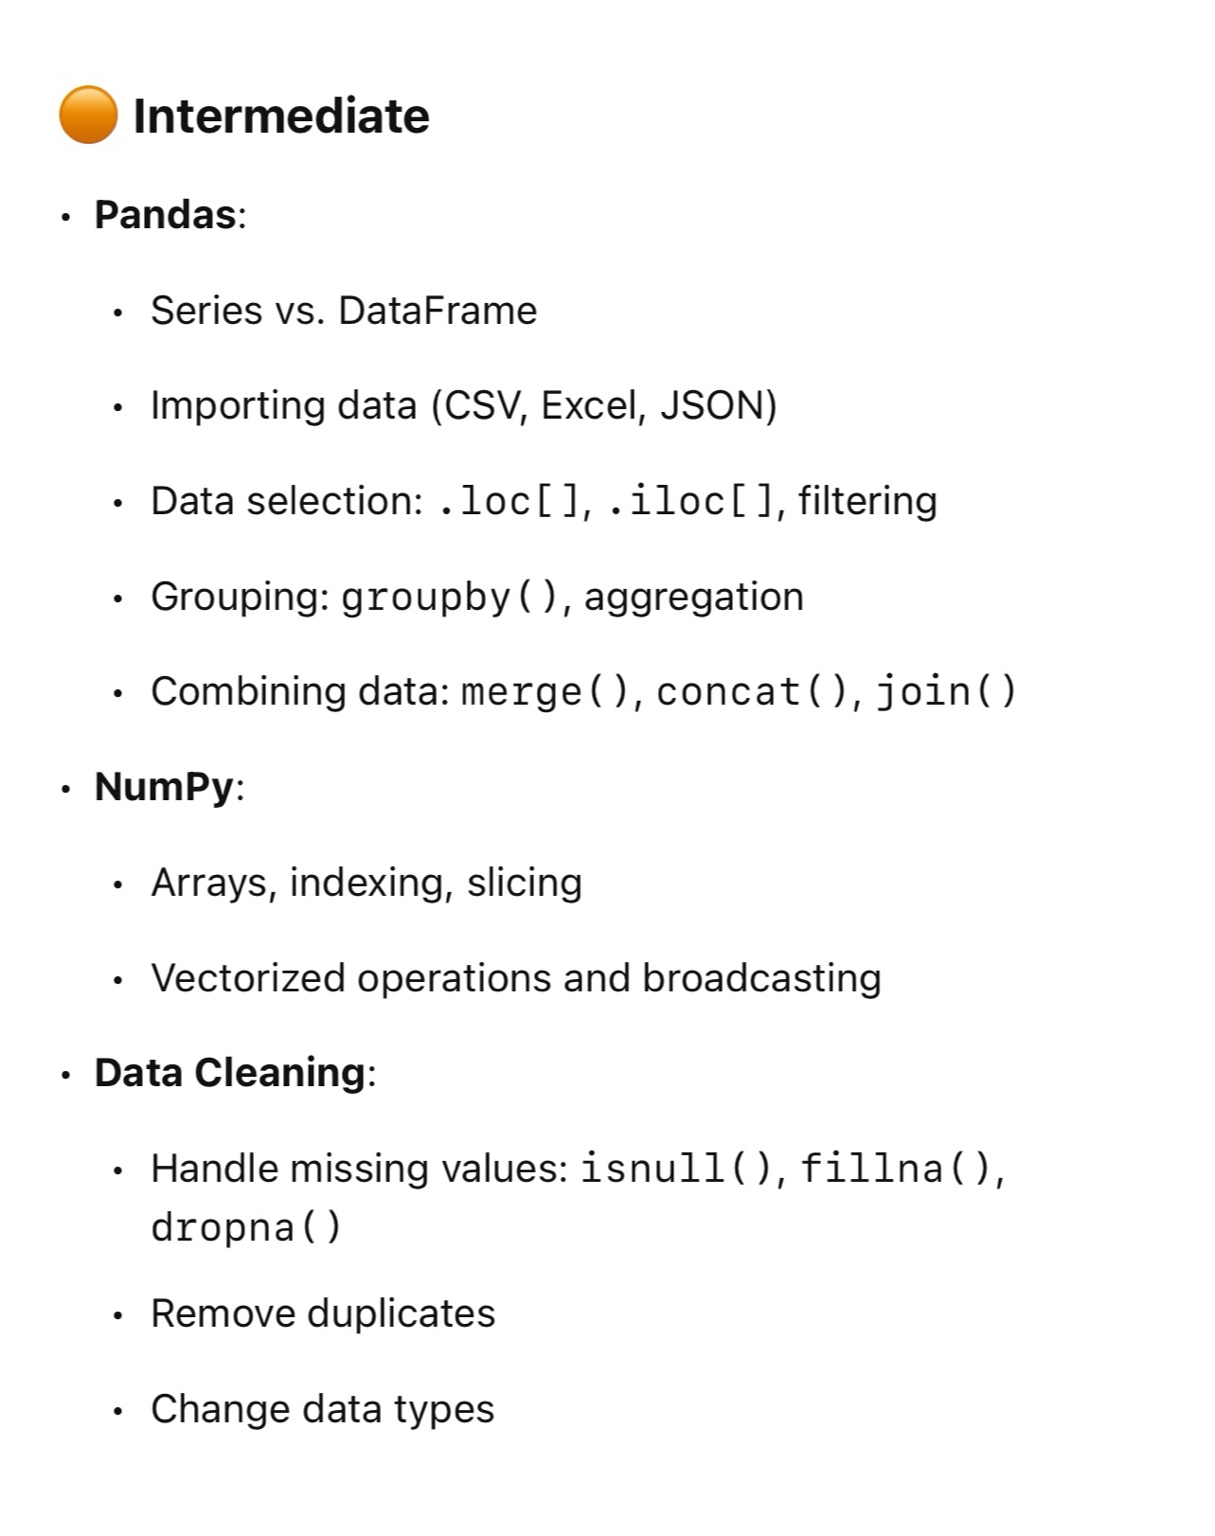
The Pandas library is your best friend when working with structured data.
- 🧱 Data Structures:
SeriesandDataFrames - 📥 Import/export: CSV, Excel, JSON, SQL
- 🔎 Filter, select, and slice data
- 📊 Group data with
groupby()and create pivot tables - ⚙️ Apply custom logic with
apply()andmap() - 🔗 Merge and join datasets for richer insights
3️⃣ NumPy for Numerical Analysis
NumPy offers high-performance tools for working with numerical data.
- 📊 Understand
arraysvs. Pythonlists - 🧪 Create and reshape arrays
- 🔄 Slice, index, and manipulate data
- 🚀 Perform vectorized operations and broadcasting
- 📈 Use built-in stats functions like
mean(),median(),std()
4️⃣ Matplotlib & Seaborn for Data Visualization
Bring your data to life with beautiful and meaningful charts:
📈 Matplotlib
- Create line, bar, and scatter plots
- Customize fonts, colors, axes, and legends
🎨 Seaborn
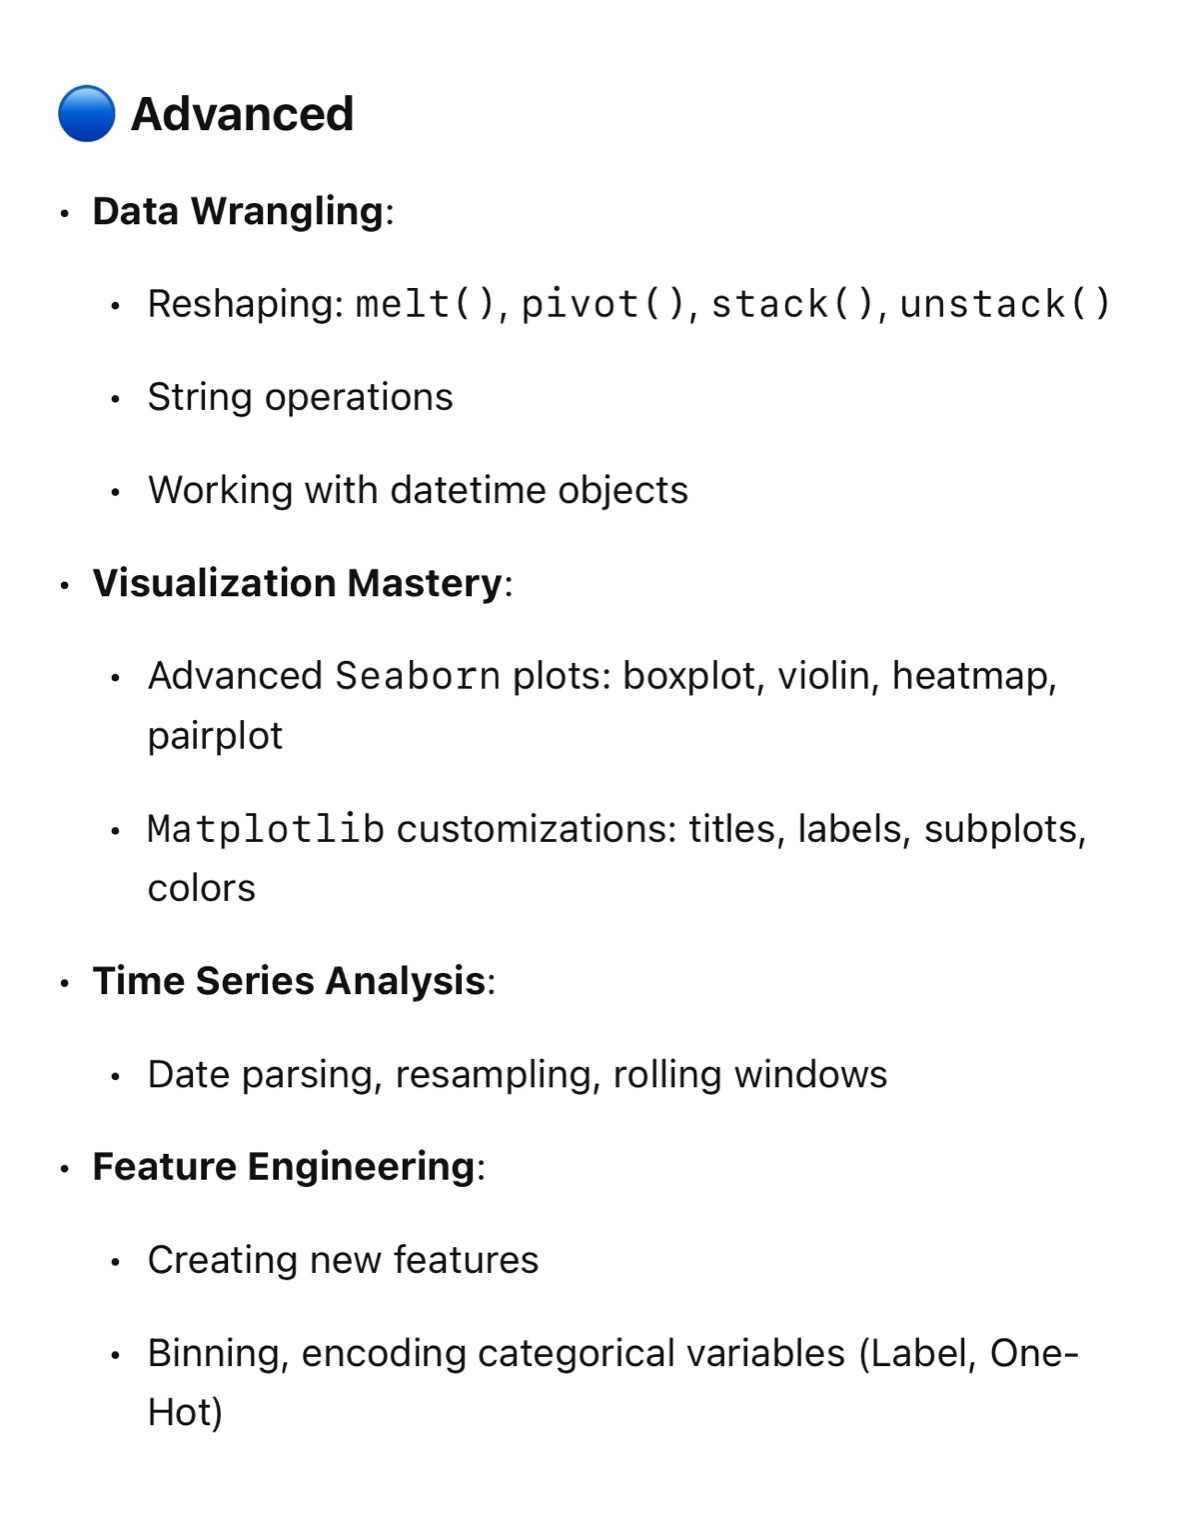
- Create advanced visuals:
pairplot,boxplot,violin,heatmap - Tell better data stories with themes and palettes
📌 Great visualizations reveal patterns and outliers you might miss in raw data.
5️⃣ Data Cleaning & Transformation with Python
Clean data = accurate insights. Use these Python tools to tidy up your data:
- 🧼 Handle missing values:
dropna(),fillna() - 🚫 Remove duplicates
- 🔄 Convert data types (e.g.,
strtodatetime) - 🔤 Manipulate text data with string methods
- 🧠 Engineer new features for deeper analysis
6️⃣ Data Wrangling Techniques
Reshape, reformat, and prepare data for analysis.
- 🔄 Reshape with
melt()andpivot() - 🕰️ Work with Time Series data
- 🚨 Detect and handle outliers
- ⚖️ Normalize and standardize data
- 🔢 Encode categorical variables (One-Hot, Label Encoding)
7️⃣ Exploratory Data Analysis (EDA)
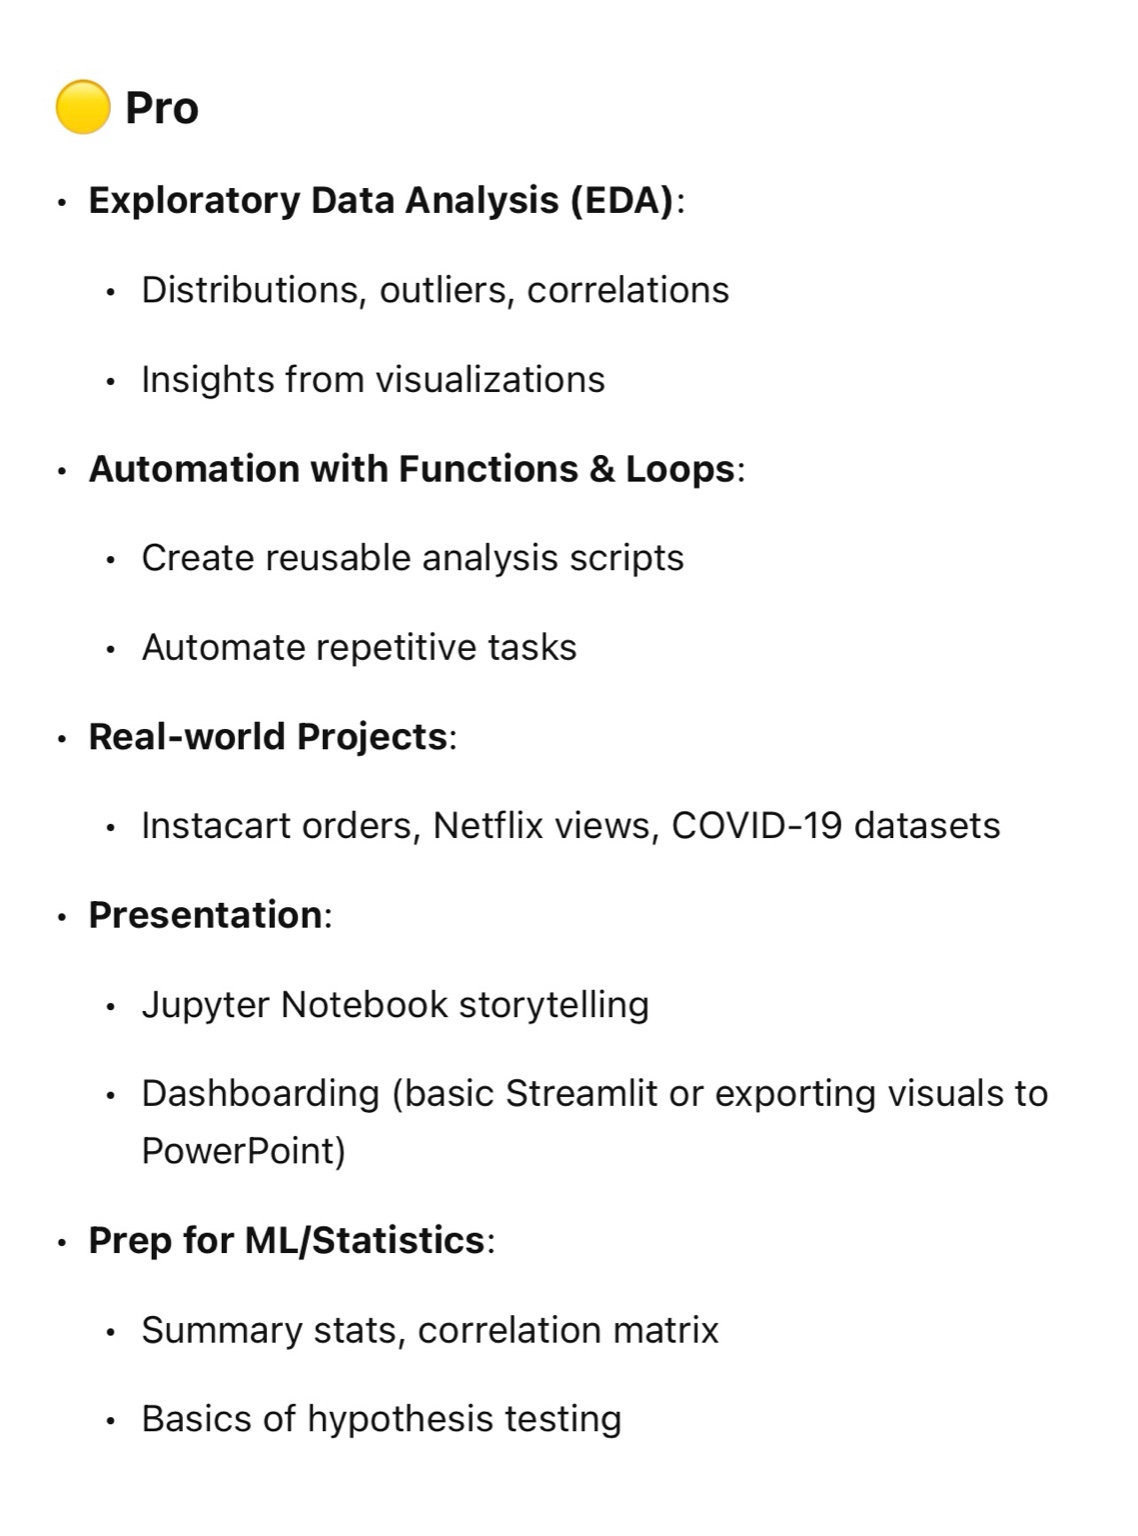
Explore, question, and understand your dataset with confidence:
- 📊 Examine distributions with histograms and boxplots
- 🔍 Discover trends and relationships
- 📈 Analyze correlations between variables
- 🧮 Generate summary stats with Pandas
- 🧠 Visualize insights using heatmaps, pairplots, and more
🧪 Final Project: Real-World Data Analysis
Put your skills to the test with a real dataset!
Example Datasets:
- COVID-19 data
- Instacart Grocery Orders
- Netflix Viewer Activity
- Any Open Data from Kaggle or Data.gov
Project Steps:
- 🧹 Clean and transform raw data
- 📊 Visualize trends and patterns
- 🧠 Perform exploratory data analysis
- 🎯 Present findings via Jupyter Notebook or PowerPoint deck
🎯 What’s Next?
Congrats! You’ve just completed a huge milestone in your data journey. In Phase 5, we’ll explore statistics and probability — the backbone of predictive analytics and machine learning.
Project: “Customer Churn Analysis Using Pandas & Seaborn”
Objectives:
-
Clean and explore a Telco churn dataset
-
Handle missing values, outliers
-
Use groupby(), value_counts(), and basic EDA
-
Visualize churn patterns using Seaborn (bar, box, heatmaps)
-
Bonus: Save cleaned dataset as a CSV for dashboard use
Python turns data into action. The more you explore, the more powerful your insights become.

